Analytics & Reporting
Reporting that has everything
Bring your entire data story together. Track attribution accurately, analyze complex sales funnels, measure ROI across all paid activities, and more. Give every department the exact insights they need without the data silos.


Over 50 pre-built reports. Unlimited custom.
Most teams stitch together 4–6 tools to get a complete picture. Incendium replaces them all — with more depth, better data, and reports that actually look good.

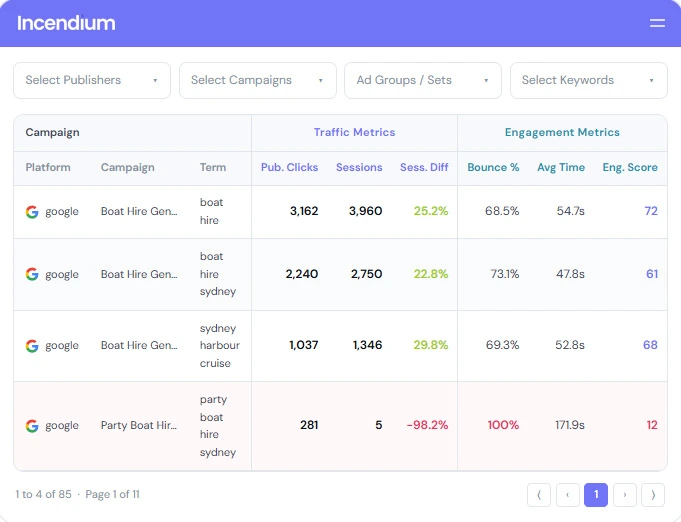
Ad Performance Analysis
See true ROI across every paid platform — Google, Meta, TikTok — with cost data pulled automatically and attribution applied independently of platform reporting.

Funnel Analysis
Map your entire conversion funnel, identify where users drop off, and quantify the revenue impact of every friction point — in dollar terms.

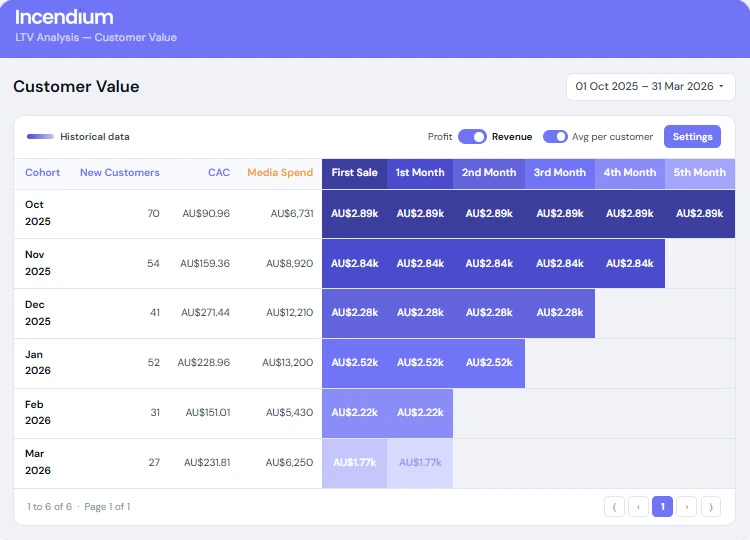
LTV Analysis
Cohort-based lifetime value tracking by acquisition source, campaign, and product. Know which customers are actually worth acquiring — not just the cheapest to acquire.

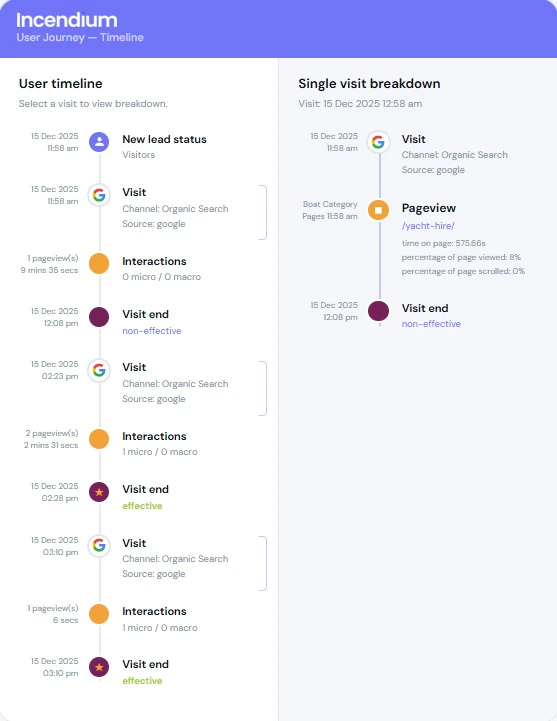
Audience Intelligence
New vs returning, geo breakdowns, user journey mapping, and deep audience comparison — understand who your buyers really are and how they behave.

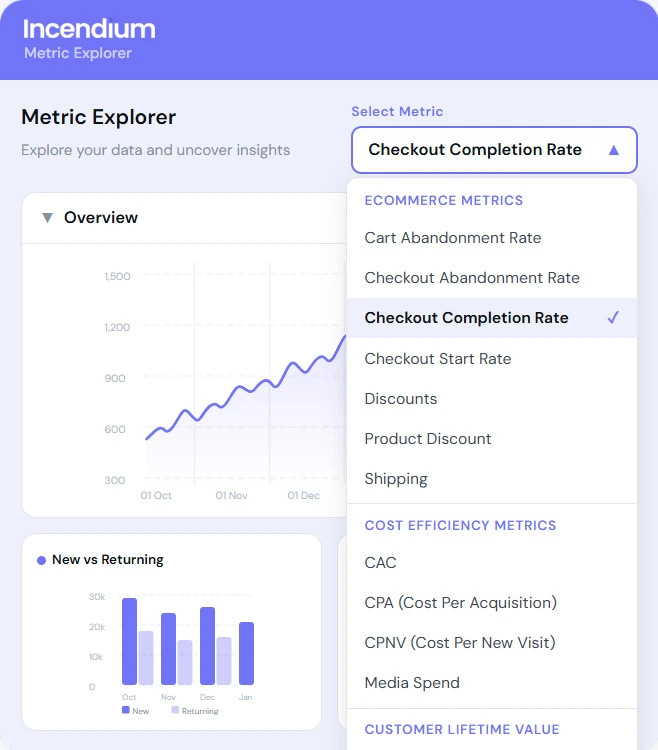
Metrics & Dimensions Explorer
Slice any metric by any dimension instantly — no SQL, no data team. Channel by device by cohort by campaign, in seconds.

Custom Dashboards
Build multi-tab dashboards for any team. Schedule reports to land in any inbox automatically — no more manual exports or slide decks.
Spend data pulled directly from Google Ads, Meta, TikTok, Pinterest, and more — no manual CSV exports, always current.
Your ROAS is calculated using Incendium's own attribution, not the platform's self-reported numbers. See which campaigns are genuinely profitable.
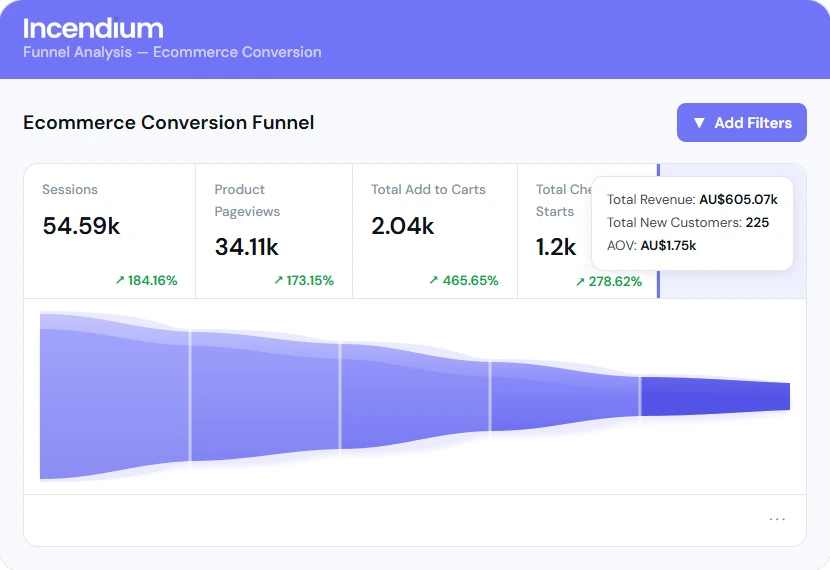
Define any sequence of events as a funnel — pageviews, add-to-carts, checkouts, form submissions, custom events — with no limits on steps.
Every drop-off is automatically translated into lost revenue, so you can prioritise CRO efforts by actual dollar value, not gut feel.
Compare funnel performance across traffic sources, device types, audience segments, or campaign — side by side in one view.
See how each monthly acquisition cohort retains and spends over time — broken down by channel, campaign, or product.
Compare 12-month LTV across traffic sources. Discover which channels acquire high-LTV customers vs high-churn customers.
Upload CRM and sales data to bring offline purchase history into your LTV model — a complete picture, not a partial one.
CVR, AOV, and session depth compared between new and returning visitors — so you know exactly how much acquisition vs retention is worth to you.
Revenue and conversion rate broken down by country, state, and city. See where your best customers are — and where your paid spend is being wasted.
The actual paths visitors take before converting or leaving. See which pages build purchase intent and which ones kill it.

Pre-built reports, ready to use
Organized into 6 categories covering every part of your marketing and ecommerce operation. Start with a pre-built report or customize it to fit exactly what you need.
Here are just some of our key reports.
10 Reports
5 Reports
4 Reports
5 Reports
5 Reports
6 Reports
Why not just use platform reporting?
Here's how Incendium compares to relying on native ad platform attribution.
Cross-channel, unified view
.png)

Platform-independent data

Engagement-based credit weighting
Customizable attribution model
No iOS / ad blocker blind spots
Real-time budget recommendations
.png)

"We increased ROAS by 48% in 6 months through data-driven budget redistribution. For the first time we had attribution we could actually trust — not just what Meta was telling us."
"For the first time, we could see exactly which funnel was driving conversions — not just what the ad platforms were claiming. That clarity is what gave us the confidence to scale."
"Incendium is honestly astounding in terms of what you can do with it. There are so many different ways to leverage the system, and it feels like every time we log in we discover another smart use case."
"Any time I've had an idea or function needed, they've stepped up to try and find a solution. That's a rare quality these days. 100% would recommend."