
Introduction
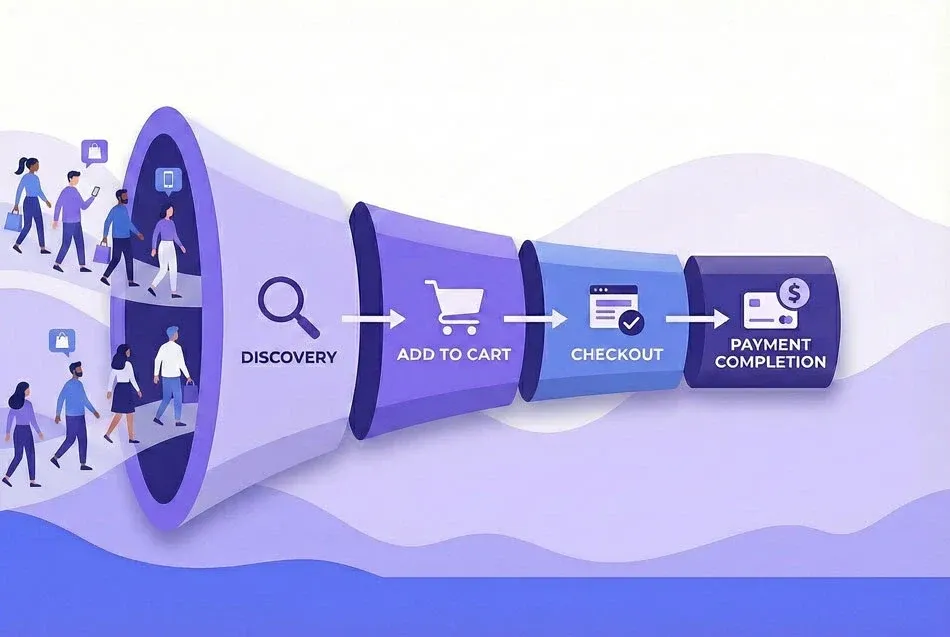
To truly optimize conversion rates and improve revenue in ecommerce, you need to go beyond just monitoring the overall sales conversion rate. While the sales conversion rate provides a top-level measure of your site's effectiveness in driving sales from visits, examining different event conversion rates can yield deeper insights into the customer journey and help pinpoint specific areas for improvement.
Analyzing 'Add to Cart' Conversion Rate
Looking at the add to cart conversion rate can reveal how well your product pages are convincing visitors to add items to their cart. If this rate is low, it might suggest that product descriptions, images, or the perceived value of the product aren't compelling enough.
Investigate page interactions, such as image scrolling or video plays, that are most likely to lead to an add to cart action. For instance, if high image gallery interaction correlates with high-performing product pages but is low on poorly performing ones, improving product imagery could be the key to boosting add-to-cart rates.
Key optimization strategies for add-to-cart conversion:
● Analyze which product page elements (image galleries, videos, size guides) correlate with higher add-to-cart rates on your best-performing products, then implement these features across underperforming pages.
● Test different product image styles and quantities - lifestyle photography versus white background, 360-degree views, or customer-submitted photos - to identify what resonates with your audience.
● Examine the relationship between time on page and add-to-cart actions. If visitors who spend more time convert better, focus on creating more engaging content. If quick visitors convert better, streamline your pages to reduce decision fatigue.
● Monitor scroll depth on product pages. If most add-to-cart actions happen after visitors scroll past certain content (like detailed specifications or reviews), ensure this critical content is prominently placed and easily accessible.
Examining Checkout Completion Rate
Checkout completion rate - the percentage of people who start the checkout process and actually complete their purchase - can highlight friction points causing cart abandonment. High drop-off rates during checkout may indicate issues like unexpected shipping costs, complicated checkout forms, or concerns about payment security.
By identifying these barriers, you can implement targeted optimizations such as streamlining the checkout process, offering free shipping thresholds, or enhancing payment security assurances.
Key optimization strategies for checkout completion:
● Track exactly where users abandon during checkout. If most drop off on the shipping page, costs may be too high or presented too late. If they leave on payment entry, security concerns or form complexity could be the issue.
● Test checkout length and complexity. Single-page checkouts often outperform multi-step processes, but this varies by industry and AOV. Higher-value purchases may benefit from a more considered multi-step approach that builds confidence.
● Ensure shipping costs are transparent early in the journey. Unexpected costs at checkout are the leading cause of cart abandonment. Display estimated shipping on product pages or offer free shipping thresholds to manage expectations.
● Offer multiple payment options. Different customers have different payment preferences, and lacking their preferred method can be a deal-breaker. Consider digital wallets, buy-now-pay-later options, and traditional payment methods.
● Implement trust signals throughout checkout: security badges, money-back guarantees, and customer service contact information. These reduce anxiety during the final, most critical stage of the purchase.
Taking Conversion Rate Analysis Further
Breaking down conversion rates even further allows analysis of the impact of specific elements on the user journey. By closely monitoring detailed event conversion rates and understanding the behaviors and interactions that lead to conversions, you can make data-driven decisions to optimize each step of the customer journey.
This granular approach not only leads to increasing sales conversion rates but also enhances the user experience, leading to higher customer satisfaction and long-term loyalty.
Advanced event conversion analysis:
● Track micro-conversions that indicate engagement: video plays, size guide opens, review reads, and zoom interactions. Understanding which interactions precede purchases helps you optimize for the behaviors that matter most.
● Segment conversion analysis by customer type. New versus returning visitors, different traffic sources, and various device types all show different conversion patterns. Personalize experiences based on these segments rather than applying one-size-fits-all optimizations.
● Analyze the time between events. How long between first visit and purchase? Between add-to-cart and checkout? Long delays might indicate comparison shopping or budget constraints, while very short times might signal impulse purchases. Design your follow-up strategies accordingly.
● Monitor assisted conversions and multi-touch journeys. Many customers don't convert on first visit. Understanding the typical path to conversion - which pages they visit, which channels they use, how many sessions they need - helps you optimize for real customer behavior rather than idealized single-session conversions.
Conclusion
Conversion Rate is an important metric for understanding how effectively your website converts visitors into customers. While the overall sales conversion rate provides valuable insights, analyzing specific conversion rates for different events along the customer journey offers deeper understanding and opportunities for optimization.
By analyzing and improving areas like add to cart rates and checkout completion rates, you can identify and address obstacles in the customer journey, leading to increased revenue and a better user experience. The key is moving beyond surface-level metrics to understand the specific behaviors and friction points that define your customers' experience, then systematically addressing each opportunity for improvement.