
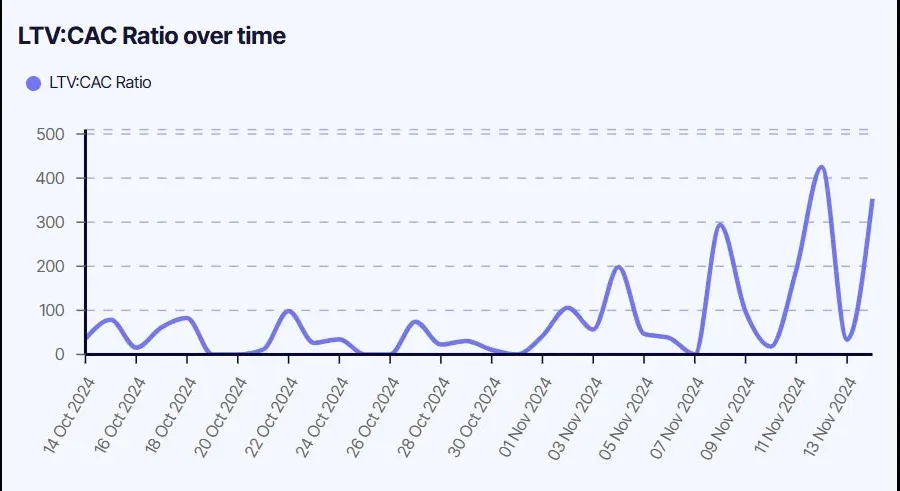
What is LTV:CAC?
The LTV:CAC ratio compares how much revenue or margin a customer generates over time with what it costs to acquire them. It is one of the clearest signals of marketing efficiency and sustainable growth.
LTV:CAC Ratio = Customer Lifetime Value ÷ Customer Acquisition Cost
- A ratio of 1:1 means the business is breaking even on acquisition.
- 3:1 is generally considered healthy.
- 5:1 or higher can indicate that the business is underinvesting in growth.
A weak ratio points to unsustainable acquisition. A strong ratio shows that customer value is compounding beyond the cost required to win that customer.
How to Calculate LTV:CAC
Calculate lifetime value and customer acquisition cost separately, then divide LTV by CAC.
Customer Lifetime Value
LTV = Average Order Value × Purchase Frequency × Customer Lifespan
For a profitability-based view, use contribution margin rather than gross revenue.
Customer Acquisition Cost
CAC = (Total Marketing Spend + Total Sales Spend) ÷ Number of New Customers
Use the same acquisition period and cohort for both sides of the ratio. Segmenting by channel, campaign or cohort makes the result far more actionable than a single blended figure.
LTV:CAC Ratio Calculator
Calculation Example
If average customer lifetime value is $450 and the target ratio is 3:1, the maximum allowable CAC is $150.
$450 ÷ 3 = $150 maximum CAC
LTV is realised over time, so the ratio should be considered alongside cash flow and payback period rather than treated as a complete view of current financial health.
What’s a Good LTV:CAC Ratio?
| Business model | Healthy range | Red flag |
|---|---|---|
| SaaS | 3:1 to 5:1 | Below 2:1 |
| Ecommerce subscription | 3:1+ | Below 2:1 |
| Ecommerce one-off | 2:1 to 3:1 | Below 1.5:1 |
| DTC products | 3:1 to 4:1 | Below 2:1 |
These benchmarks assume average margins. Contribution-margin LTV can produce lower ratios while still giving a more accurate profitability view.
Why the detail matters
A blended ratio can hide unprofitable channels. CAC and LTV should be aligned to the same acquisition cohort, adjusted for returns and churn, and reviewed over a customer’s full lifecycle.
Incendium connects advertising spend, revenue, margins, retention curves and attribution so LTV:CAC can be reviewed by channel, campaign, customer segment and acquisition cohort without maintaining a separate spreadsheet model.
LTV:CAC FAQ
Why should LTV and CAC use the same cohort?
Comparing current acquisition costs with the lifetime value of a different or historically stronger customer group produces a misleading ratio. Align both figures to the same acquisition cohort.
Should LTV use revenue or contribution margin?
Revenue-based LTV is simpler, but contribution-margin LTV accounts for costs such as shipping, cost of goods, transaction fees and discounts and therefore gives a clearer profitability view.
Can a high LTV:CAC ratio be a problem?
A ratio above 5:1 can indicate underinvestment. The business may be able to spend more on acquisition while maintaining a healthy margin and growing faster.
How can the ratio be improved?
Increase LTV through higher order values, stronger retention and higher-value customer segments, or reduce CAC by improving conversion rates, fixing post-click journeys and removing wasted advertising spend.