
A/B Test Results
Evaluate test performance and decide what to do next.
Updated 9 August 2026Select the Campaign and analytical period
Open Optimize → A/B Testing → A/B Test Results. Set the date range, then choose the Campaign from the dropdown or selection table. The initial table provides Pageviews, Effective Pageview Rate, Visitors, Pageview Interactions, Impacted Conversion Count and Impacted Conversion Rate for available campaigns.
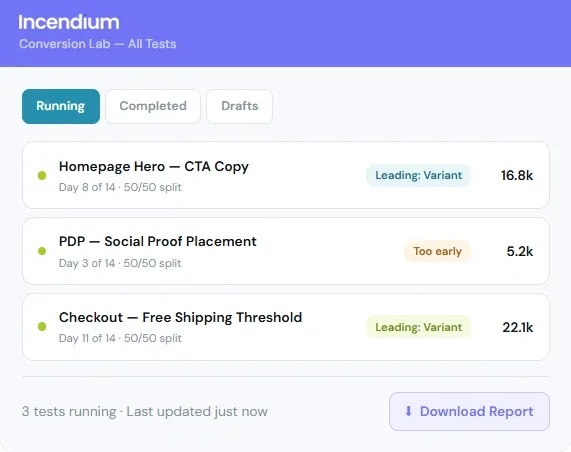
Read Key Statistics first
The selected report places Variant and Control side by side for:
- Pageviews and Effective Pageview Rate.
- Average Time on Page, Viewed Percentage and Scrolled Percentage.
- Interactions and Interaction Rate.
- Impacted Conversions and Impacted Conversion Rate.
- Session Conversions, Conversion Rate and Landing Page Session Conversion Rate.
Check exposure before interpreting a percentage. A large relative change based on very few visitors is not a reliable decision.
Use the supporting views
Traffic-source charts reveal whether Variant and Control received materially different acquisition mixes. Trend charts show whether a gap was persistent or caused by a short spike. The leads progress indicator shows exposure against the Campaign limit where one exists.
Device and Browser tables help identify a change that works overall but fails in one technical context. Investigate those differences in the relevant responsive layout before declaring a universal winner.
Make a commercial decision
The change may attract attention without improving the intended action. Review the hypothesis and Conversion path.
Confirm the effect is durable across time and important devices before adopting the variant.
Consider a targeted Personalization rather than replacing the control for everyone.
Continue only if the Campaign remains valid and no external change has compromised the comparison.
Record the outcome and reason for the decision. Do not keep a Campaign active indefinitely after it has answered the question.