
Incrementality Tests
Create and review tests designed to measure incremental impact.
Updated 9 August 2026Measure what the marketing activity caused
Attribution explains how observed journeys receive credit. A geo incrementality test asks a different question: what would have happened if activity had been reduced in one region? Incendium compares a geographic holdout with suitable control regions to estimate causal impact.
Open Optimize → Incrementality → Tests and choose New Test. The current available design is Geo Switch-Off; Geo Rollout is shown as coming soon.
Design the holdout
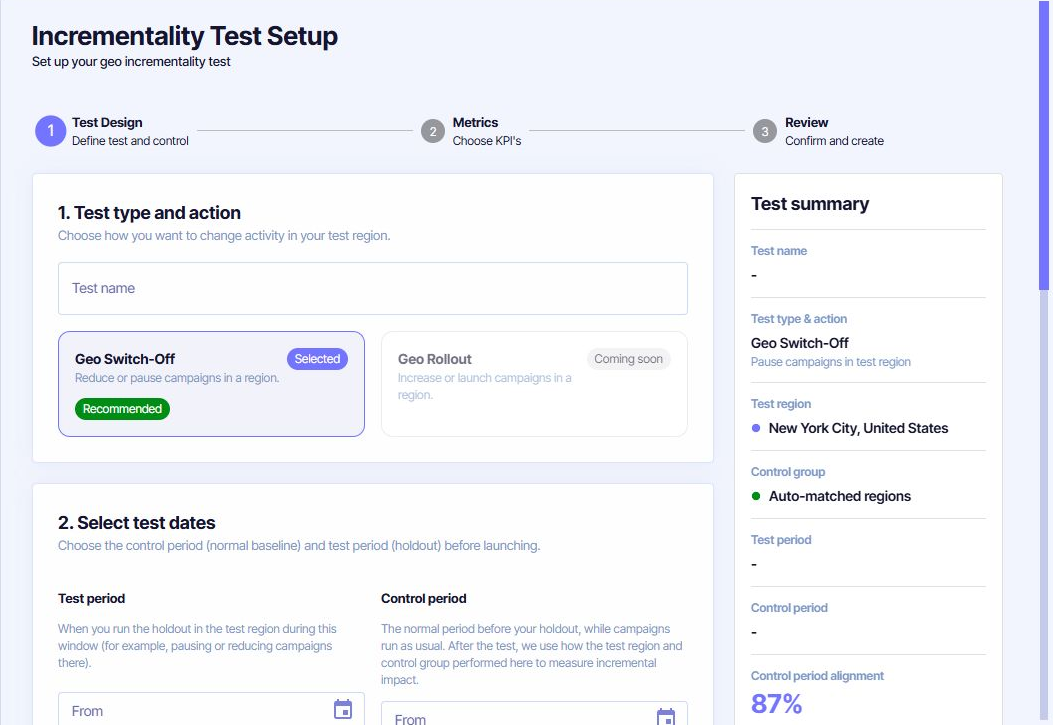
Name the test
Identify the channel or activity, region and intended action so the operational change is unambiguous.
Choose the test period
This is when the team pauses or reduces the relevant campaigns in the test region.
Choose the control period
Use a normal preceding period while campaigns ran as usual. Incendium uses it to understand how the test and control areas behaved before the holdout.
Select the test region
Choose the geographic area where the real campaign change will occur.
The team must pause or reduce the intended advertising in the test region for the complete test period. A test without the operational holdout cannot establish the intended contrast.
Choose the control group
Incendium selects regions that behaved similarly over the previous 90 days. The preview reports alignment using traffic volume, Conversion rate, Channel mix and trend alignment.
Uses the remaining regions in the same country. This is simpler but may contain areas that behaved differently before the test.
The interface identifies this option as coming soon.
Review the matched regions and overall similarity score. A control group should resemble the test region before the holdout; a low-quality baseline weakens the causal comparison.
Select the metrics
Choose one primary metric for incremental impact. The available choices include Revenue per session (recommended), Conversion rate, Effective session rate, Average order value and Total revenue.
Add up to six supporting metrics to explain the result. Available drivers include Effective session rate, Add to cart rate, Checkout completion rate, Organic sessions, Average order value and Cart abandonment rate. Supporting metrics add diagnosis; they should not replace the preselected primary decision measure.
Review before creating
The Review step restates the action, test and control dates, region, control group quality, primary metric and supporting metrics. It also repeats the required advertising change. Go back and correct any mismatch before choosing Create Test.
After creation, the Tests list records region, control period, test dates, status and creation time. Open the completed result to compare the observed test-region outcome with the control-based expectation. Interpret the estimated lift alongside control similarity and whether the planned holdout was executed for the full period.