
Chart Builder
Create a chart from Incendium metrics, dimensions and filters.
Updated 9 August 2026Turn a question into a reusable chart
Chart Builder is the workspace for creating project-specific charts from Incendium metrics, dimensions and filters. Use it when a standard report does not answer the question precisely, or when the same analysis should be reused in a dashboard.
Open Report > Chart Builder. The Chart Library can be filtered by snapshots, trends, attributions, tables, maps and statistic cards, and searched by name. Reuse an existing chart where it already expresses the same metric definition; create a new one when the analytical question or permanent scope is materially different.
Write down the measure, the comparison group and the intended time grain. A clear definition produces a chart that remains useful after the immediate investigation.
Start in Chart Designer
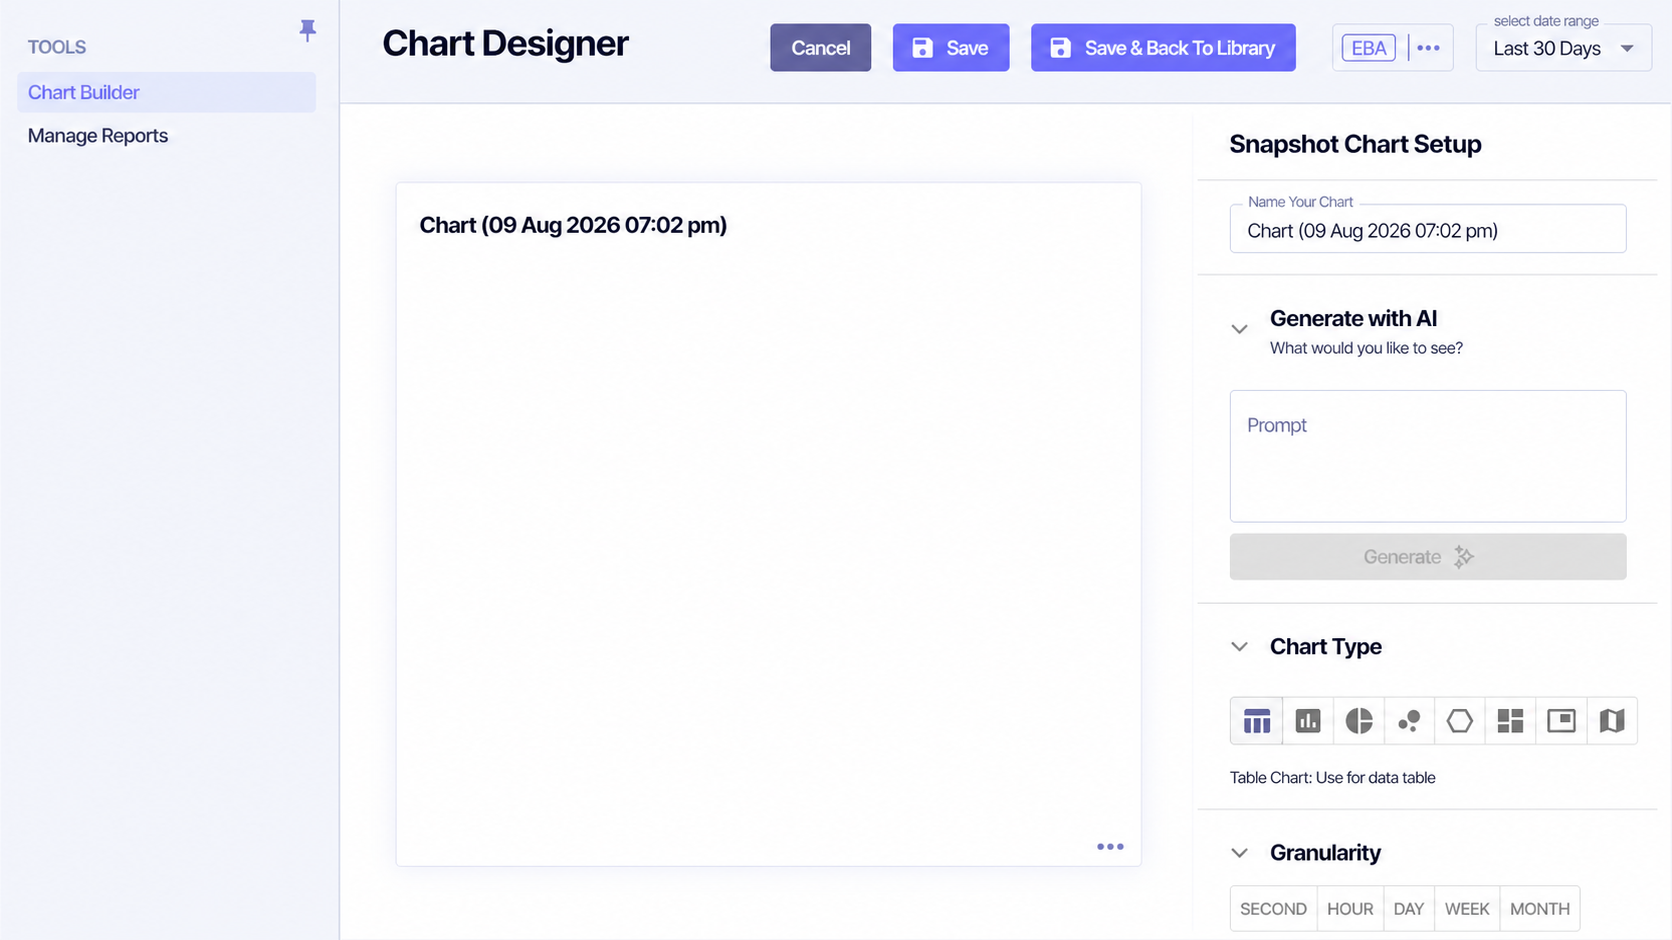
Choose Create new chart, give the chart a business-facing name and set the report date context. The preview updates as the configuration develops.
Generate with AI can turn a plain-language request into a starting configuration. State the metric, breakdown, time grain and any essential scope. Review every generated choice before saving; the resulting chart should still express the question you intended.
Choose the chart structure
Select the presentation that fits the question: a table for exact rows, a trend for movement over time, or another available visual for composition, distribution or geography.
Choose second, hour, day, week or month where the chart type supports time. Use the coarsest grain that still reveals the pattern.
Select the attributes used to group the result, such as date, Channel, campaign, Location or product.
Select the measures shown for each row or group. Add only metrics that help answer the same decision.
Optional Rows / Dimensions lets report viewers switch between approved dimensions. Because optional dimensions are shown one at a time and are excluded from exports, use fixed dimensions when the exported structure matters.
Control the result set
- Order By selects the metric used to rank results.
- Limit caps the number of returned groups.
- Include Subdomains expands the analysis beyond the root domain.
- Include (Not Set) retains records whose selected dimension has no recognised value.
- Crawler Settings can exclude crawlers, include them with people, or show crawlers only.
- Rows Per Page and Show Totals affect presentation, not exported data.
Chart Filters are permanent parts of the chart. Use them for scope that should always apply, such as one Channel or Location. Use report-level controls for questions viewers should be able to change.
Save and maintain the chart
Save stores the chart and keeps the designer open. Save & Back To Library stores it and returns to Chart Library. After saving, check the visual with more than one date range and verify that labels, totals and empty states remain understandable.
Charts built from Incendium's shared metrics and dimensions can be reused across dashboards without rebuilding the analytical definition each time. That consistency makes repeated decisions—and downstream AI interpretation—less dependent on ad hoc spreadsheet logic.